My Garmin Forerunner 245 watch records my heart rate, stress levels, steps, activities, sleep, location, and much more throughout the day. The resulting data can be viewed on the associated Garmin mobile phone app and via the Garmin Connect web service.
The watch is a fantastic piece of technology, but there is no way to download the data it collects as a simple CSV or Excel file. Instead it stores all collected data in proprietary .FIT binary files. These can be copied across to PC via USB from the watch, or exported via Garmin Connect online and downloaded….but how to open and read them?
One way to handle .FIT files is to import them into Golden Cheetah which is software designed for use by cyclists and triathletes to analyse their training data. This works fine for sporting activities such as runs, but it shows all other .FIT files as being empty.
Searching further online, I stumbled upon FitCSVtool. This is a command line tool designed to convert .FIT files into readable text files. It is a small part of the Garmin FIT SDK – a software development kit provided by Garmin for developers who need to process .FIT files.
I downloaded it (https://developer.garmin.com/fit/download/) and installed everything on my Windows PC.
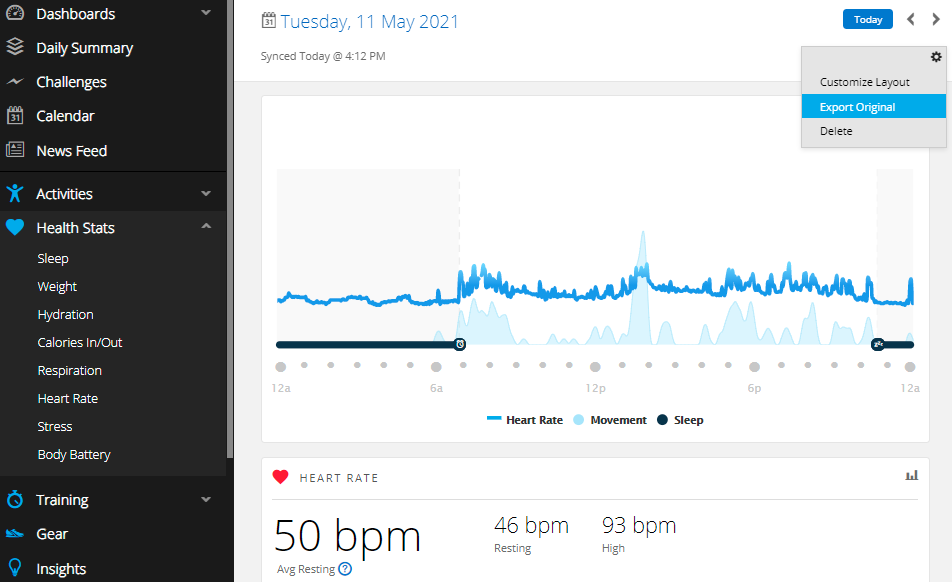
First things first, I needed .FIT files to process. Accessing Garmin Connect, I clicked on Health Stats > Heart Rate which brought up the screen as shown below. Clicking on the gear icon (top right) and then on Export Original results in a .ZIP file being downloaded.

The contents of this .ZIP file when extracted are a collection of files of three types – WELLNESS, METRICS, and SLEEPDATA as pictured below.

There was only one METRICS file, and it was very small. I wasn’t interested at this time in SLEEP_DATA, so I assumed that the WELLNESS files would contain the heart rate data I was looking for.
Following the instructions available here: https://developer.garmin.com/fit/fitcsvtool/windows/, I processed one of the WELLNESS .FIT files, and a CSV file was output and dumped in the same folder as the original .FIT file. I opened this in Excel and it looked like quite a complicated mess of data, but I did see references to timestamps, heart_rates, and bpm.

Rather than digging around and trying to make sense of the CSV file right away, I decided first to automate the process of converting all of the WELLNESS files for a given day so that I’d have a full day of data to combine and analyse.
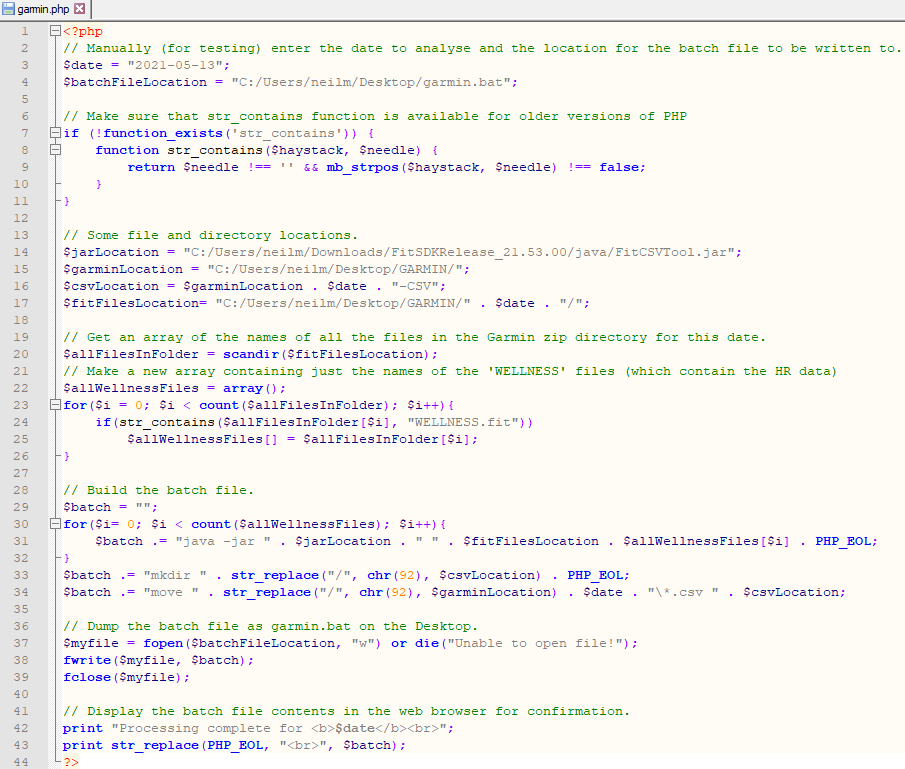
I wrote a rough and ready PHP script to go into the directory of unzipped .FIT files from Garmin for a particular day, identify the WELLNESS files I wanted, generate a batch file which when run would convert each WELLNESS file to a .csv file and then move those .csv files into a new directory.

Below is an example of the batch file generated for the watch data collected yesterday (12th May 2021). In total there were 12 WELLNESS .FIT files generated during the day, and the batch file will use FitCSVTool to process each one in turn before dumping them all in a new folder called 2021-05-12-CSV.

Double-clicking on the batch file will cause it to run, but running it via the command prompt is better when testing so that the terminal output can be read and checked over to ensure that everything seems to be working as expected. Below show my running a batch file earlier today – not a full day, so only six WELLNESS files.

Executing the batch file results in a directory as shown below for yesterday’s data – a collection of .csv files containing all of the collected WELLNESS data for a particular day.

In Excel I did Data > Get Data > From File > From Folder and browsed to find the directory containing my converted .fit to .csv files. I selected Combine and Transform, and then used Power Query to delete all but three columns – one column which contained heart rate data, one column which identified when a row contained heart rate data, and one column which contained timestamp data.

The timestamps were never on the same row as the heart rate data to which they were associated, so a little data-wrangling was going to be necessary.
Next to the table of imported data, I added a column. Each cell in the new column would look at the cell on its row in the TimeStamps column. If the value it contained was a number in excess of 900000000, the cell in the new column took that value, otherwise it took the value of the previous cell from the new column. In this way, every row is associated with the most recent timestamp.
Looking now at the timestamps, they appeared to be different from usual. The standard UNIX timestamp is the number of seconds since 1st Jan 1970 – approx 1.62 billion today (13th May 2021). Looking online I found that you have to add 631065600 to the Garmin timestamp value to get to the UNIX timestamp from which in Excel you can use:
=(timestamp/86400)+DATE(1970,1,1) to get the Excel serial datetime for each timestamp.
As it is currently British Summer Time (GMT+1), I had to amend the above to:
=((timestamp+3600)/86400)+DATE(1970,1,1)
With that sorted, I added another couple of columns to show the date and time in a human readable format.
The screenshot below shows the raw csv file data in blue, and the columns I added in black. I copied the heart rate column to the right of my new Time column to facilitate charting, and also used conditional formatting to highlight the heart rate readings (= any cell in column H which had ‘bpm’ in column C on the same row).

Cell J2 contains =FILTER(C:H,C:C=”bpm”). This filters everything in columns C to H to only show rows which contain ‘bpm’ in column C (displayed in columns J to N coloured in red above) therefore we now finally have the date and time for every heart rate reading for further analysis and visualisation.
(I also added column P which shows the hour of the day for each heart rate reading for use in hourly averaging and charting etc.)
With everything set up, it is now possible to quickly display visualisations for the heart rate data for any day (for which .FIT files have been downloaded from Garmin Connect). For example, my heart rate through the 24 hours of 11th May 2021 is shown below.

And here is a summary of my sleeping heart rate from the first seven hours of the same day 00:00 to 06:59

All in all this is a long-winded bodgie way of getting around Garmin’s choosing to not enable CSV or Excel file exports of data from their products. It really shouldn’t be so complicated.
When I have the time, I’ll automate everything (including the .FIT file downloads from Garmin) using Python and drop all of the extracted data into a MySQL database from which it can be visualised with Excel, Power BI, Matplotlib, etc.
Update 20 May 2021
I have now written a Power Shell script file to automate the pre-processing of the garmin .FIT zip files after they have been downloaded from connect.garmin.com, and updated the PHP script to automatically build the FIT file processing batch file for multiple days (and zip files) of downloaded data.

The only thing left to automate now is exporting (downloading) new data files from Garmin whenever I open the Excel workbook, run the Power Shell script, and Refresh the visualised data in Excel.
I have also set up the Excel worksheet I use to visualise the data with a drop down menu to select the day to view. From this selection, the associated folder name is generated, and Power Query grabs the CSV files from the folder, cleans them, and shows them in the worksheet.
