The chart below shows the weekly percentage growth in the number of cases of Covid-19 detected in the UK. On the second axis it shows the 7-day rolling average of the number of daily cases.
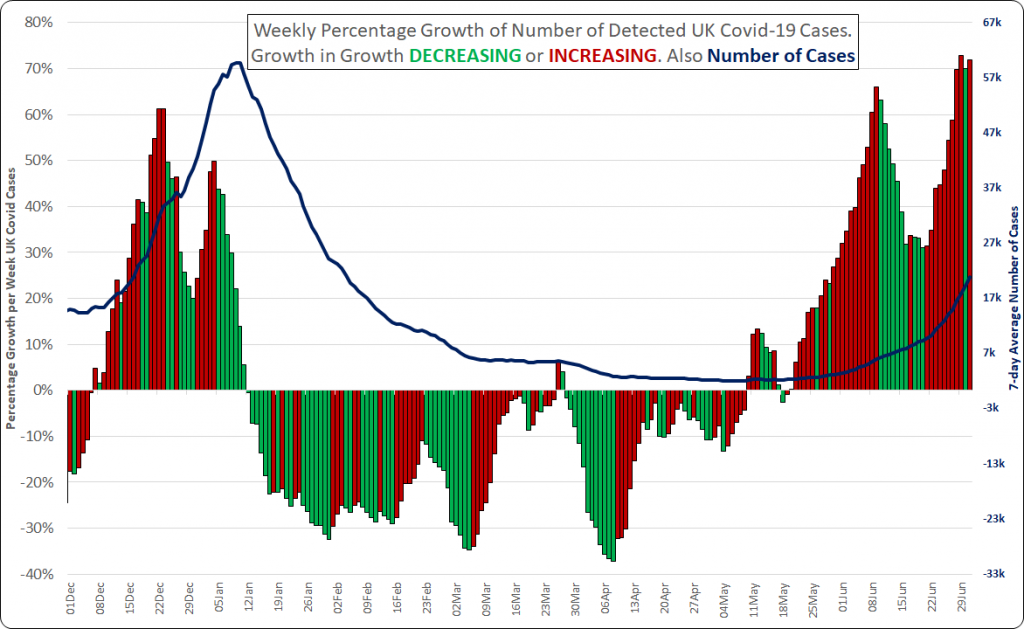
It certainly looks as though we will be seeing 50k new cases detected per day before the end of July 2021.