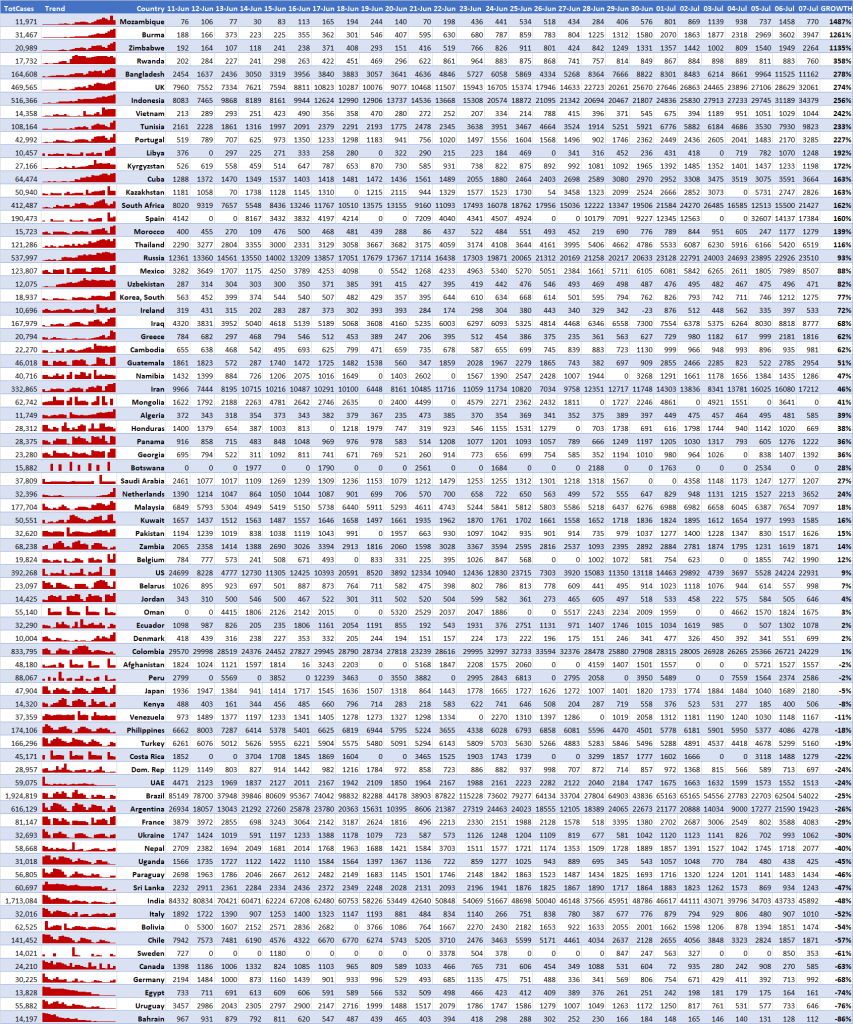
Below is a chart to show the growth in the number of reported Covid-19 cases for all countries reporting >10,000 new cases in the last 28 days.
“GROWTH” measures the increase in the number of reported cases of the last 7 days relative to the first 7 days of the 28 days leading up to today (8th July 2021).
Click on the chart to view in full size.

Raw data from Johns Hopkins University: https://data.humdata.org/dataset/novel-coronavirus-2019-ncov-cases.