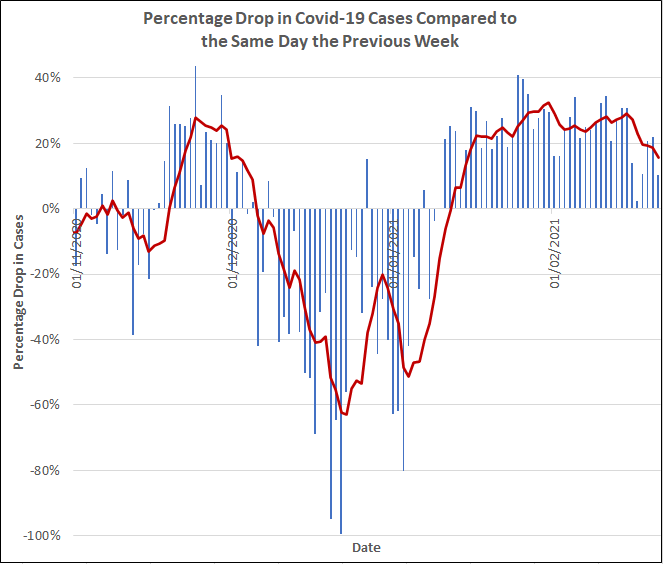
The chart above shows the percentage drop in detected Covid-19 cases comparing each day to the same day one week earlier, and covering the dates from 1st Nov 2020 to 21st Feb 2021.
The trend shows that (even before the lifting of restrictions from lockdown #3), cases could start increasing again by mid-March 2021.
[Raw case data from https://coronavirus.data.gov.uk/details/cases]